President Trump announced this morning that the U.S. has ‘confines of a deal’ with China. The deadline imposed on China is August 12, and August 1 for the other countries, most notably the UK, India, Brazil, and Canada. Reportedly, most, if not all trade deals will get done by the August 1 deadline. A trade deal with the EU has a 50-50 chance of being completed before the deadline. The trade deal progress will likely hurt the metals in the near term, especially with rising treasury yields and a stronger dollar over the past couple days.
I expect a pullback in the stock market at some point, as the S&P 500 continues rally to new all-time highs. The S&P 500 has moved higher and higher after making a V-shaped recovery from the April low, but momentum appears to be waning, as the S&P 500 has not had a gain of more than 1% since June 24. The stock market has rallied due to the strength of the leading stocks, rather than a broad-based advance. The stock market tends to be seasonally weak towards the latter part of summer, starting around Labor Day. When a pullback occurs, more buying should follow in gold and silver, and could extend to platinum, copper, and palladium.
If you like this article and would like to receive more information on the commodity markets, please use the link to join our email list
The next Fed meeting is scheduled for Wednesday. According to CME’s FedWatch tool, there’s a 4.7% chance that the Fed will ease interest rates by a quarter-point, meaning there’s 95.3% chance of no change. However, interest rate traders are pricing in a 60% probability of a quarter-point cut at the September meeting. An interest rate cut would be bullish for metal prices and could provide a catalyst for a bounce in prices and potentially new all-time highs.
Use the link below to see Wednesday's metals trade ideas.
Gold appears to have very good support around $3,325 and $3,315 in the August contract. At the time this article was written, the 100-day moving average was at $3,269. Over the past 25 years, gold has risen between July 6 and February 24 in 21 out of 25 years, with an average gain of nearly 10%. Over the past 15 years, gold has delivered a 4.68% average return from June 27 to September 2. Looking back 57 years, gold has an average return of 3.30% from July 5 to September 21.
If you like this article and would like to receive more information on the commodity markets, please use the link to join our email list
This week’s Commitment of Trader’s report (COT), won’t be released until later today. As of last Friday, managed money was long 143,000 contracts, up 4,000 contracts from the previous week. For the week ending July 1, managed money was long 136k contracts. The recent COT reports show a clear trend of managed money increasing their gold positions.
Silver
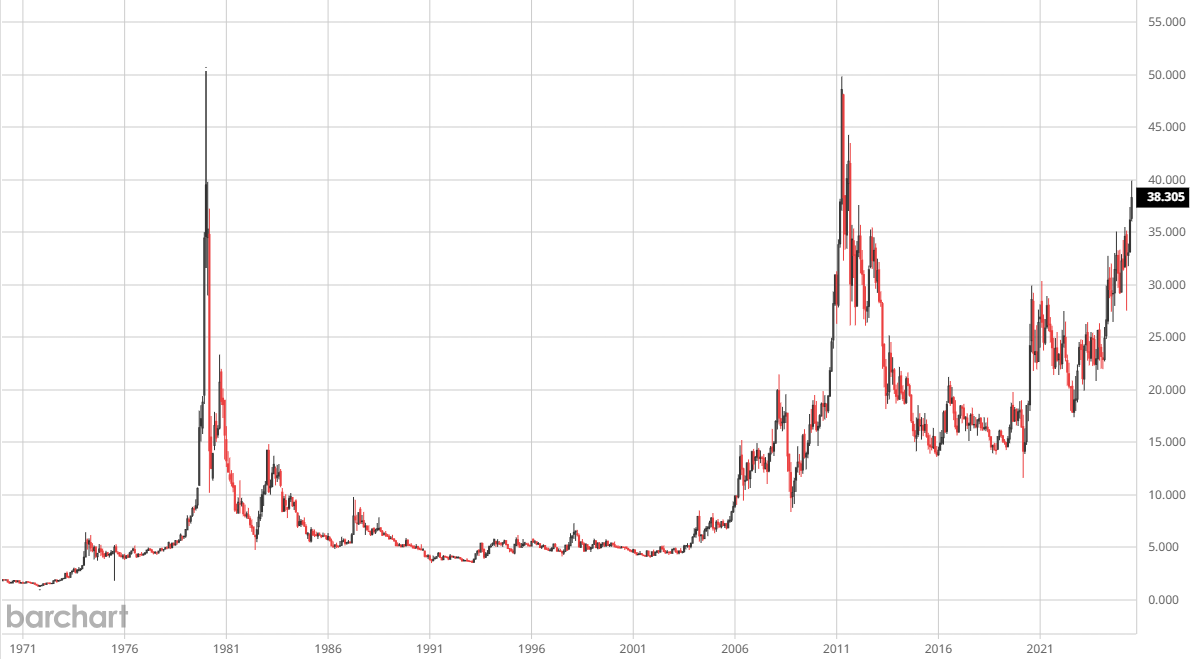
September silver has strong support levels around $37.75 and $36.85. The 50-day moving average was at $37.693. Silver doesn’t have a strong seasonal trend for July, but over the last 5 years, it had a 8.79% return from September 29 to December 25. Looking at the silver chart, there’s a 40+ year cup and handle pattern, with the cup forming from the 1970’s to 2010 and the handle from 2010 to today. Silver could make an explosive move and test the previous highs made on April 28, 2011 at $49.50, and January 17, 1980 at $49.95 as the stock market may be getting frothy and investors start seeking protection.
September Silver Monthly Chart
Platinum
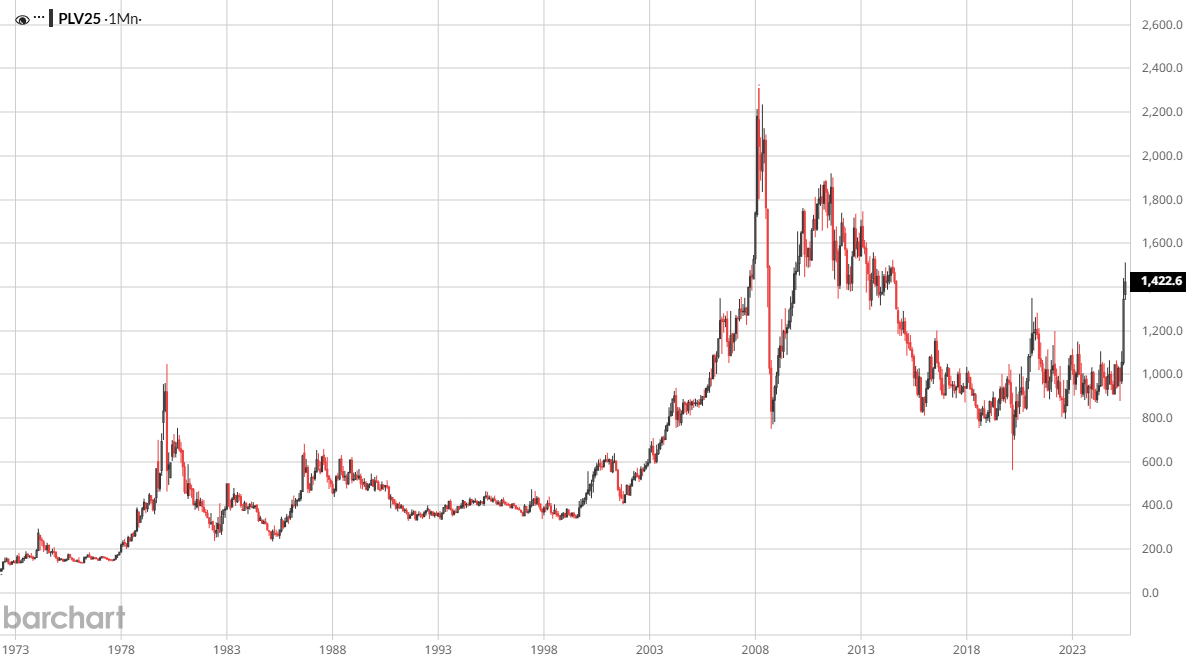
October platinum has support at $1,400 and $1,388. The 20-day moving average was at $1,419.4. Platinum doesn’t have a strong seasonal trend for July, but looking a little farther out, platinum had an 8.25% return from September 26 through December 25 over the past 5 years.
October Platinum Monthly Chart
Palladium
September palladium has support around $1,252 and $1,230. The 20-day moving average was at $1,221.39. Pallidum has averaged a 7.88% return from July 25 to October 17 over the last 15 years. The past 5 years show a 6.45% from September 24 to December 23.
If you like this article and would like to receive more information on the commodity markets, please use the link to join our email list
September copper has support around $5.71, $5.67, and $5.60. The 20-day moving average was at $5.4767. Copper has an average return of 4.33% from October 3 to December 29 over the last 15 years. The past 5 years show a 6.45% average return from September 24 to December 23.
If you’re ready to start trading, click the link below to open an account with Walsh Trading, Inc.
This article contains syndicated content. We have not reviewed, approved, or endorsed the content, and may receive compensation for placement of the content on this site. For more information please view the Barchart Disclosure Policy here.